You know that weird moment when you’ve had a rough week, skipped sleep, eaten random snacks, and still wake up feeling like… you’re still you? The paper by Varela, Maturana, and Uribe digs into that everyday mystery from a very grounded angle: not “what are living things made of?”, but “what kind of ongoing pattern makes something a living unit at all?” Their starting point is that focusing only on parts can miss what actually matters: the organization that makes the whole hold together as one distinct “someone” or “something,” whether or not it’s reproducing.
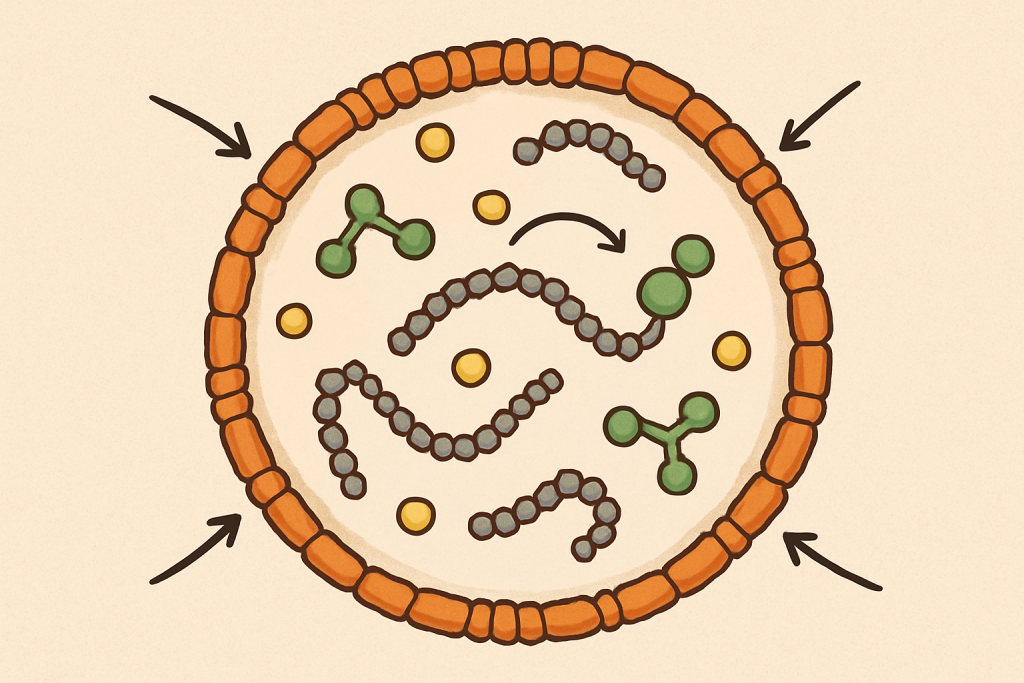
Their key idea is called autopoiesis, which basically means “self-making.” A living system, in their description, is a network of processes that continually produces the very components that sustain the network. At the same time, it builds and maintains a boundary that makes it a recognizable unit in its space. They use the cell as the easy example: a vast web of chemical reactions keeps making molecules that keep those reactions possible, and together those molecules keep the cell as a physical, separate “thing,” even though the actual matter inside is constantly being replaced. In that picture, what makes something alive is not a specific ingredient, but a looping, self-maintaining organization. That’s also why they contrast living systems with allopoietic ones: many machines produce something other than themselves, while an autopoietic system’s “output” is basically its own continued existence as that same kind of unity.
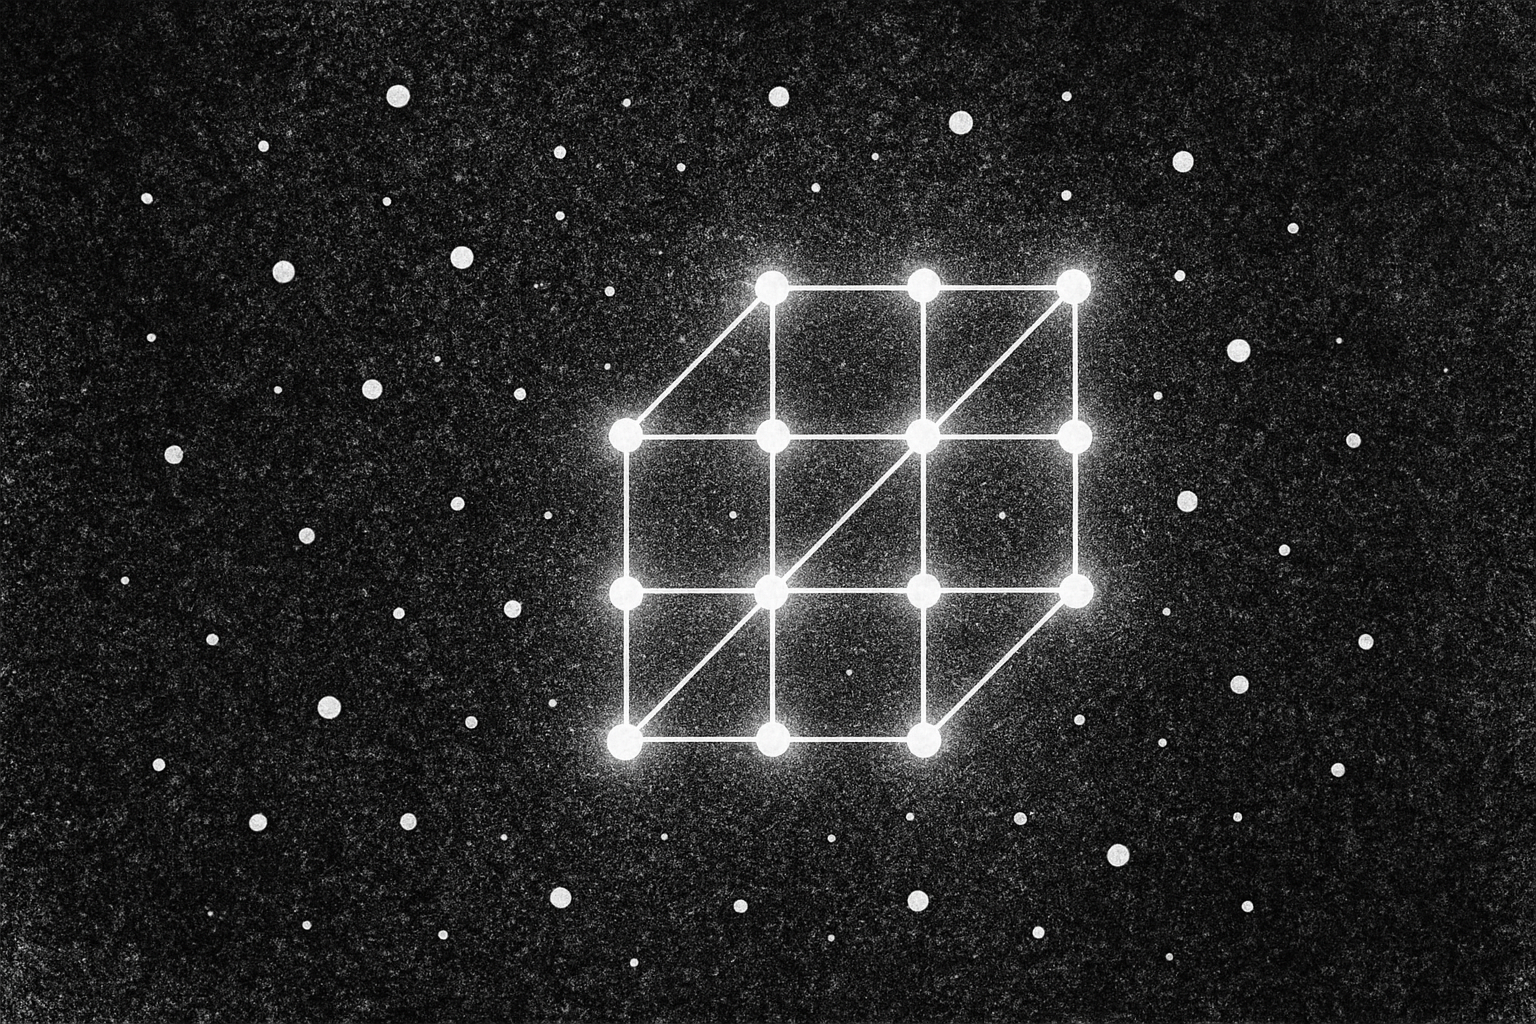
This also changes the way we think about reproduction. The authors argue that reproduction and evolution are essential. Still, they aren’t the basic definition of being alive, because you can’t reproduce unless you already have a living unity to reproduce in the first place. In their view, reproduction happens as a special case of this self-maintaining organization: the unit can split so that the same kind of self-producing network continues in two fragments. To make the idea less abstract, they present a minimal computer model in a simple grid-world: elements bump around randomly, a “catalyst” helps create “links,” and links bond into chains. Sometimes a chain closes into a loop that traps the catalyst inside. Once that happens, new links formed inside can replace boundary links that fall apart. Hence, the boundary stays intact even though parts keep turning over—like fixing a fence plank-by-plank without ever letting the yard stop being enclosed. They even give a practical “checklist” style key (six points) for deciding if something counts as autopoietic: can you find a boundary, identify components, see a rule-governed system, confirm the boundary is produced by interactions of elements, and confirm the components (including boundary ones) are continually made and participate in creating others.
The everyday takeaway is surprisingly useful: it’s a reminder to look for the pattern that keeps something going, not just the content itself. Your body, habits, relationships, even a group project, can “feel alive” or “fall apart” depending on whether the ongoing loop that sustains it is still running—and whether there’s a boundary that protects that loop from getting wrecked by every outside bump. In the paper, when the network of production breaks, the unity disintegrates; when it can compensate for disturbances, it stays autonomous. That’s a simple lens you can apply day-to-day: if you want a system (you, a routine, a shared apartment, a club) to stay stable while everything changes, focus on the repeating actions that rebuild the structure and the boundary conditions that make those actions possible. The authors even point toward how this thinking could guide attempts to build “life-like” systems in chemistry, like imagining a bubble-like structure whose membrane components are produced or modified by reactions that happen within the special conditions created by the membrane itself—because what matters most is not the material, but the self-maintaining loop that makes a unit a unit.
Reference:
Varela, F. G., Maturana, H. R., & Uribe, R. (1974). Autopoiesis: The organization of living systems, its characterization and a model. Biosystems, 5(4), 187–196. https://doi.org/10.1016/0303-2647(74)90031-8
Privacy Notice & Disclaimer:
This blog provides simplified educational science content, created with the assistance of both humans and AI. It may omit technical details, is provided “as is,” and does not collect personal data beyond basic anonymous analytics. For full details, please see our Privacy Notice and Disclaimer. Read About This Blog & Attribution Note for AI-Generated Content to know more about this blog project.